You have 8 seconds to catch the attention of your target audience. That’s it.
What does that mean for your business? Basically, in an age of marketing where your reader has an attention span shorter than a goldfish, creating engaging content is more important than ever.
When it comes to your digital marketing strategy, don’t neglect the power of interactive infographics. Adding elements of user interaction can take a static infographic to the next level — becoming an increasingly engaging piece of content and telling a more comprehensive story.
Let’s take a closer look at how interactive infographics can add value to your content marketing strategy.
What Exactly Is an Interactive Infographic?
First things first: What’s an infographic?
An infographic is essentially a graphic visual representation of information, data or knowledge aimed at presenting information in a way that’s easy to understand. This design tool is a great way to educate, inform and make complex information easily digestible for the reader. An infographic can add value to your content marketing when you want to:
- Provide a quick overview of a specific topic.
- Display data or research findings in a visually appealing way.
- Simplify a complicated concept.
- Compare and contrast multiple options.
- Raise awareness.
OK, so what’s an interactive infographic then?
An interactive infographic includes interactive user interface (UI) elements that make for a more dynamic experience. When done right, this type of content feels like an in-depth conversation with your target audience — helping users engage and make lasting connections with your brand.
Demand Gen reports 85% of B2B marketers are already using or plan to use interactive infographics as part of their strategy, where interactive content has been effective in differentiating their brands from their competitors. With the growing popularity of interactivity in mind, let’s dive into a few examples that you’ll want to follow!
Some of the Best Examples To Inspire Your Next Project
Below are 5 interactive infographics you can come back to when you need creative ideas:
1. “How Seamless Is Your Omnichannel CX?”
This interactive infographic for Zendesk, created by Brafton, allows brands to answer questions to determine how they stack up against the competition in terms of their omnichannel CX. Zendesk — providing software-as-a-service products that support improved customer service — leveraged this quiz to create a personalized experience by presenting the user with further content to consume based on their answers.
Interactive elements: This graphic is in the form of a quiz!
Why it works: This graphic is ultimately successful because it follows the rule, “keep it simple, but significant.” Turning the information and data to be presented into a quiz is a relatively straightforward idea, but it does a great job of engaging the audience. The reader has a valuable opportunity to better understand niche subject matter, and, in this case, where they stand in comparison to others — offering a more personalized experience.
2. “My Home vs Mahomes”
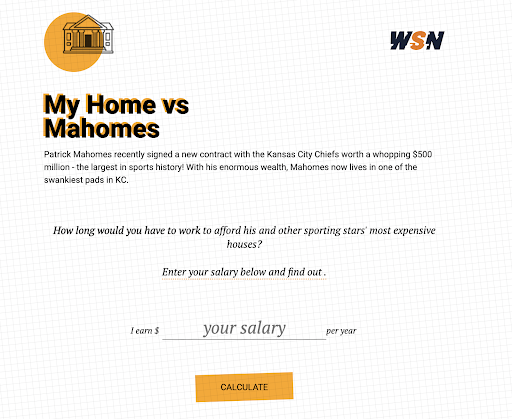
This infographic from World Sports Network (WSN) allows the reader to input their salary to see how long it would take them to purchase the homes of several professional athletes — including National Football League MVP, quarterback and Super Bowl champion, Patrick Mahomes. WSN, a leader in sports news and resources, used this infographic to not only bring attention to their brand, but also help readers gain perspective on just how massive NFL and other sports contracts can be.
Interactive elements: User input modifies and personalizes the infographic.
Why it works: This infographic is effective because it requires limited interactivity from the user. With one action, viewers can enjoy an engaging and personalized experience that’s likely to sustain their interest in the page. It’s also a simple and effective way to put a niche topic into perspective for the reader.
Give this slightly-maddening graphic a go, here.
3. “The New New York City Skyline”
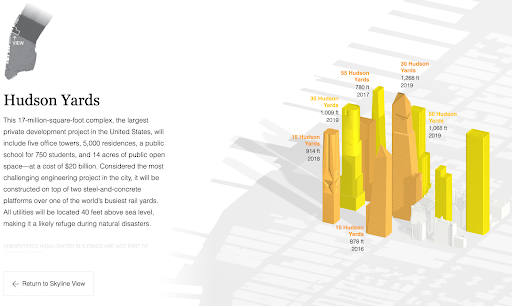
With Manhattan seeing an exceptional boom in tall buildings — which are rapidly and radically changing the skyline — the National Geographic online publication shared this infographic to give viewers a unique perspective into how the skyscrapers in the city were scheduled to look by the end of 2020. Users can interact with this graphic by scrolling through and viewing the separated 3D sections. Buildings are color-coded and labeled, and the reader can hover over or click on elements to learn more along the way.
Interactive elements: This graphic features scrolling and hovering effects, clickable elements and 3D imaging.
Why it works: This one infographic packs a lot of information. And, it gives the user that information in engaging and bite-sized pieces, allowing the reader to explore the details at their own pace. By taking this informative content from intriguing to captivating, viewers are not only more likely to actively participate in and enjoy the experience but also retain the information they learned much longer.
Interactive infographics are a great resource to support your content, but if you’re in a pinch for time, this type of graphic might not be your simplest choice. In fact, it requires a bit of work to do successfully. But, if you have a more flexible timeline and you’re willing to put in the effort, you certainly won’t regret it!
Try it out for yourself here.
4. “An Animated Chart of 42 North American Butterflies”

Tabletop Whale creates original science illustrations that are made as an aid to help individuals gain a deeper understanding of specific science-themed topics. They designed this animated infographic to educate viewers about a host of butterfly species in North America.
Interactive elements: This graphic uses animation to bring these butterflies to life.
Why it works: Using micro-animations, the infographic is immediately eye-catching and serves both entertainment and educational purposes. While adding animation was a seemingly simple choice, it makes a significant difference in how any reader will eventually consume the content — elevating a static infographic and supporting greater engagement.
Take a look.
5. “An Analysis of the Beatles?”
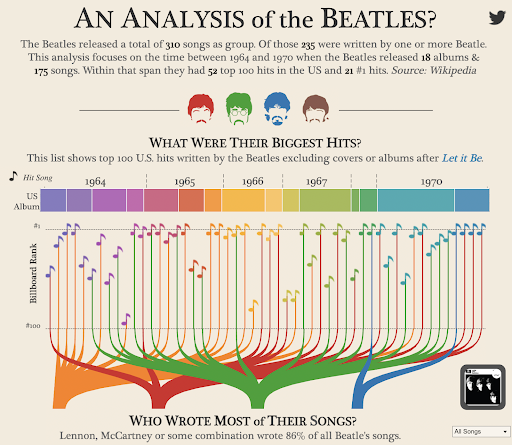
One of my personal favorites, Dueling Data’s interactive infographic tells a clear and visual story of information surrounding the Beatles and their music throughout their careers.
Interactive elements: This infographic takes advantage of hovering effects and clickable elements.
Why it works: As a Beatles fan myself, one could argue that this is a pretty interesting topic to begin with. So, why opt for a graphic with interactivity at its core? In this case, an interactive infographic works because such a prolific band means there’s immense data to showcase and highlight — which can be difficult to display in a clear or concise way. This content succeeds at presenting all of the data gathered (which is clearly a lot) in a visually appealing, engaging and understandable way.
You can check it out here.
If interactivity is the future of data visualization, how can you make the most of this type of design tool?
A Guide To Creating an Engaging and Interactive Infographic
When it comes to the possibilities of interactive infographics, the examples discussed are just the tip of the iceberg. Eager to get started on an interactive piece for your content? Understandable, of course. But, wait for just a second!
Before diving in, take a look at our guide for creating interactive graphics successfully:
1. Collect Necessary Data and Effectively Communicate the Information
The first step to make virtually any content is gathering data. For someone who’s well-versed in the marketing space, this initial action may seem pretty obvious, but it really is the foundation for a successful process.
Why?
Uninteresting and irrelevant data won’t become magically riveting with the addition of visuals. The information you’re presenting needs to be just as captivating as the interactive elements you plan to include for the most powerful visual storytelling.
2. Organize Your Data With Compelling Visuals
Now, you can consider the visual elements that would be fitting for your content — which is what makes an infographic unique in the first place. Instead of your humdrum list of facts or statistics, you can incorporate interesting visuals to maintain reader interest and engagement.
Suitable, attention-grabbing visuals can add flavor to an otherwise dull presentation of information. Here are just some of the elements you might include:
- Digital images.
- Icons.
- Symbols.
- Illustrations.
- Charts and graphs.
Remember: Consistency is key! The same is true for your visual content. Pay attention to the color, tone and the type of visual elements you plan to make use of, and don’t stray too far from that path.
3. Determine and Apply the Interactive Elements You Want To Include
Now that you have a pretty clear picture of what you’re going for, It’s finally time to start thinking about the interactive portion of your information graphic. Exciting, right?
For the best results, you need to identify and apply the interactive elements that not only complement the data you’re presenting but bring it to life for your viewers. This can make all the difference. While the options for interactive features are practically endless, here are a few ideas to get you started:
- Including embedded video or audio.
- Adding popups.
- Incorporating clickable elements.
- Leveraging hover effects.
- Using animation.
Pretty simple right? You’re essentially approaching the process like you would any other infographic and adding the interactive elements you need for a more engaging user experience. When a static infographic isn’t enough to help viewers engage or understand the topic at hand, interactivity can save the day.
The Value of Visual Storytelling and Data Visualization
At the end of the day, an interactive experience makes for an engaging infographic — and that’s good for your brand and your bottom line.
Captivating viewers helps them derive true value from your content, which is the cornerstone of keeping your brand at the front of consumers’ minds and building long-term loyalty. And if the road to lasting consumer loyalty starts with something as simple as creating interactive infographics that support your information-rich content, why not take advantage of it?
It’s time to see where visual storytelling and data visualization can take your content!